Examine frequency distributions
Examine frequency distributions, for variables internetuserate, polityscore urbanrate, incomeperperson.
Code:
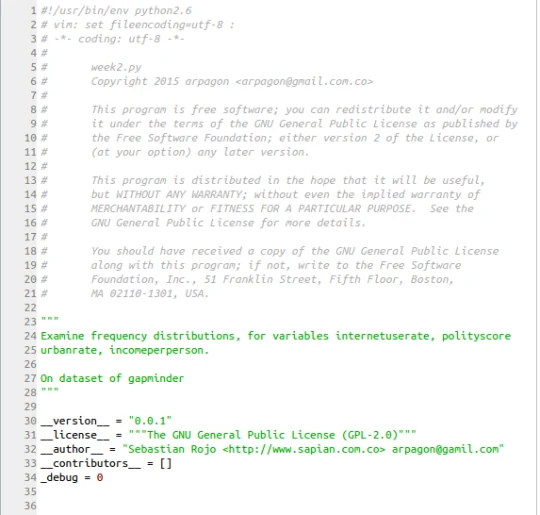
#!/usr/bin/env python2.6
# vim: set fileencoding=utf-8 :
# -*- coding: utf-8 -*-
#
#       week2.py
#       Copyright 2015 arpagon
#
#       This program is free software; you can redistribute it and/or modify
#       it under the terms of the GNU General Public License as published by
#       the Free Software Foundation; either version 2 of the License, or
#       (at your option) any later version.
#
#       This program is distributed in the hope that it will be useful,
#       but WITHOUT ANY WARRANTY; without even the implied warranty of
#       MERCHANTABILITY or FITNESS FOR A PARTICULAR PURPOSE.  See the
#       GNU General Public License for more details.
#
#       You should have received a copy of the GNU General Public License
#       along with this program; if not, write to the Free Software
#       Foundation, Inc., 51 Franklin Street, Fifth Floor, Boston,
#       MA 02110-1301, USA.

"""
Examine frequency distributions, for variables internetuserate, polityscore
urbanrate, incomeperperson.

On dataset of gapminder
"""

__version__ = "0.0.1"
__license__ = """The GNU General Public License (GPL-2.0)"""
__author__ = "Sebastian Rojo  @arpagon"
__contributors__ = []
_debug = 0


import pandas
import numpy

data = pandas.read_csv("gapminder.csv", low_memory=False)

print('Dataset gapminder \n')

print('Obeservations:', len(data)) #number of observations (rows)
print('Variables:', len(data.columns)) # number of variables (columns)

print('\n\nVariables chosen for the study are: internetuserate, polityscore')
print('Additional variables for the assignment: urbanrate, incomeperperson')

#internetuserate
data['internetuserate'] = data['internetuserate'].convert_objects(
                                                        convert_numeric=True)

print('\n==Counts for internetuserate==')
print('Internet users (per 100 people) Internet users are people with access\n'
      'to the worldwide network.')

internetuserate_count = data['internetuserate'].value_counts(sort=False)
print (internetuserate_count)

print('\n==Percentages for internetuserate==')
print('''Internet users (per 100 people) Internet users are people with access
to the worldwide network.''')

internetuserate_percent = data['internetuserate'].value_counts(sort=False, normalize=True)
print (internetuserate_percent)


#polityscore
data['polityscore'] = data['polityscore'].convert_objects(
                                                        convert_numeric=True)

print('\n==Counts for polityscore==')
print('''Overall polity score from the Polity IV dataset, calculated by
subtracting an autocracy score from a democracy score. The summary
measure of a country's democratic and free nature. -10 is the lowest
value, 10 the highest.''')

polityscore_count = data['polityscore'].value_counts(sort=False)
print (polityscore_count)

print('\n==Percentages for polityscore==')
print('''Overall polity score from the Polity IV dataset, calculated by
subtracting an autocracy score from a democracy score. The summary
measure of a country's democratic and free nature. -10 is the lowest
value, 10 the highest.''')

polityscore_percent = data['polityscore'].value_counts(sort=False, normalize=True)
print (polityscore_percent)

#urbanrate
data['urbanrate'] = data['urbanrate'].convert_objects(
                                                        convert_numeric=True)

print('\n==Counts for urbanrate==')
print('''Urban population refers to people living in urban areas as defined by
national statistical offices (calculated using World Bank population
estimates and urban ratios from the United Nations World Urbanization
Prospects)''')

urbanrate_count = data['urbanrate'].value_counts(sort=False)
print(urbanrate_count)

print('\n==Percentages for urbanrate==')
print('''Urban population refers to people living in urban areas as defined by
national statistical offices (calculated using World Bank population
estimates and urban ratios from the United Nations World Urbanization
Prospects)''')

urbanrate_percent = data['urbanrate'].value_counts(sort=False, normalize=True)
print (urbanrate_percent)


#incomeperperson
data['incomeperperson'] = data['incomeperperson'].convert_objects(
                                                        convert_numeric=True)

print('\n==Counts for incomeperperson==')
print('''Gross Domestic Product per capita in constant 2000 US$.
The inflation but not the differences in the cost of living between countries
has been taken into account.''')

incomeperperson_count = data['incomeperperson'].value_counts(sort=False)
print(incomeperperson_count)

print('\n==Percentages for incomeperperson==')
print('''Gross Domestic Product per capita in constant 2000 US$.
The inflation but not the differences in the cost of living between countries
has been taken into account.''')

incomeperperson_percent = data['incomeperperson'].value_counts(sort=False, normalize=True)
print (incomeperperson_percent)
Screenshot:
Result:
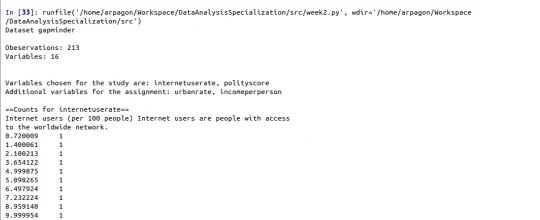
runfile('/home/arpagon/Workspace/DataAnalysisSpecialization/src/week2.py', wdir='/home/arpagon/Workspace/DataAnalysisSpecialization/src')
Dataset gapminder

Obeservations: 213
Variables: 16


Variables chosen for the study are: internetuserate, polityscore
Additional variables for the assignment: urbanrate, incomeperperson

==Counts for internetuserate==
Internet users (per 100 people) Internet users are people with access
to the worldwide network.
0.720009     1
1.400061     1
2.100213     1
3.654122     1
4.999875     1
5.098265     1
6.497924     1
7.232224     1
8.959140     1
9.999954     1
1.259934     1
11.090765    1
12.645733    1
13.598876    1
14.830736    1
...
43.055067    1
61.987413    1
7.930096     1
26.477223    1
44.585355    1
2.199998     1
53.740217    1
29.879921    1
44.570074    1
40.020095    1
2.259976     1
6.965038     1
31.568098    1
20.663156    1
28.999477    1
Length: 192, dtype: int64

==Percentages for internetuserate==
Internet users (per 100 people) Internet users are people with access
to the worldwide network.
0.720009     0.004695
1.400061     0.004695
2.100213     0.004695
3.654122     0.004695
4.999875     0.004695
5.098265     0.004695
6.497924     0.004695
7.232224     0.004695
8.959140     0.004695
9.999954     0.004695
1.259934     0.004695
11.090765    0.004695
12.645733    0.004695
13.598876    0.004695
14.830736    0.004695
...
43.055067    0.004695
61.987413    0.004695
7.930096     0.004695
26.477223    0.004695
44.585355    0.004695
2.199998     0.004695
53.740217    0.004695
29.879921    0.004695
44.570074    0.004695
40.020095    0.004695
2.259976     0.004695
6.965038     0.004695
31.568098    0.004695
20.663156    0.004695
28.999477    0.004695
Length: 192, dtype: float64

==Counts for polityscore==
Overall polity score from the Polity IV dataset, calculated by
subtracting an autocracy score from a democracy score. The summary
measure of a country's democratic and free nature. -10 is the lowest
value, 10 the highest.
 0      6
 1      3
 2      3
 3      2
 4      4
 5      7
 6     10
 7     13
 8     19
 9     15
 10    33
-1      4
-10     2
-9      4
-8      2
-7     12
-6      3
-5      2
-4      6
-3      6
-2      5
dtype: int64

==Percentages for polityscore==
Overall polity score from the Polity IV dataset, calculated by
subtracting an autocracy score from a democracy score. The summary
measure of a country's democratic and free nature. -10 is the lowest
value, 10 the highest.
 0     0.028169
 1     0.014085
 2     0.014085
 3     0.009390
 4     0.018779
 5     0.032864
 6     0.046948
 7     0.061033
 8     0.089202
 9     0.070423
 10    0.154930
-1     0.018779
-10    0.009390
-9     0.018779
-8     0.009390
-7     0.056338
-6     0.014085
-5     0.009390
-4     0.028169
-3     0.028169
-2     0.023474
dtype: float64

==Counts for urbanrate==
Urban population refers to people living in urban areas as defined by
national statistical offices (calculated using World Bank population
estimates and urban ratios from the United Nations World Urbanization
Prospects)
84.54    1
15.10    1
36.82    1
30.88    1
93.32    1
74.92    1
29.54    1
10.40    1
71.40    1
73.64    1
13.22    1
14.32    1
77.20    1
51.64    1
17.00    1
...
30.64    1
66.50    1
82.42    1
88.92    1
60.70    1
29.52    1
77.12    1
27.84    2
30.84    1
85.58    1
61.00    1
74.50    1
86.56    1
56.74    1
28.38    1
Length: 194, dtype: int64

==Percentages for urbanrate==
Urban population refers to people living in urban areas as defined by
national statistical offices (calculated using World Bank population
estimates and urban ratios from the United Nations World Urbanization
Prospects)
84.54    0.004695
15.10    0.004695
36.82    0.004695
30.88    0.004695
93.32    0.004695
74.92    0.004695
29.54    0.004695
10.40    0.004695
71.40    0.004695
73.64    0.004695
13.22    0.004695
14.32    0.004695
77.20    0.004695
51.64    0.004695
17.00    0.004695
...
30.64    0.004695
66.50    0.004695
82.42    0.004695
88.92    0.004695
60.70    0.004695
29.52    0.004695
77.12    0.004695
27.84    0.009390
30.84    0.004695
85.58    0.004695
61.00    0.004695
74.50    0.004695
86.56    0.004695
56.74    0.004695
28.38    0.004695
Length: 194, dtype: float64

==Counts for incomeperperson==
Gross Domestic Product per capita in constant 2000 US$.
The inflation but not the differences in the cost of living between countries
has been taken into account.
2668.020519     1
5634.003948     1
6147.779610     1
772.933345      1
26551.844238    1
1543.956457     1
13577.879885    1
115.305996      1
523.950151      1
33923.313868    1
1860.753895     1
5900.616944     1
20751.893424    1
786.700098      1
275.884287      1
...
722.807559      1
5188.900935     1
32292.482984    1
495.734247      1
10480.817203    1
5528.363114     1
242.677534      1
2534.000380     1
16372.499781    1
2549.558474     1
760.262365      1
31993.200694    1
22275.751661    1
2557.433638     1
25249.986061    1
Length: 190, dtype: int64

==Percentages for incomeperperson==
Gross Domestic Product per capita in constant 2000 US$.
The inflation but not the differences in the cost of living between countries
has been taken into account.
2668.020519     0.004695
5634.003948     0.004695
6147.779610     0.004695
772.933345      0.004695
26551.844238    0.004695
1543.956457     0.004695
13577.879885    0.004695
115.305996      0.004695
523.950151      0.004695
33923.313868    0.004695
1860.753895     0.004695
5900.616944     0.004695
20751.893424    0.004695
786.700098      0.004695
275.884287      0.004695
...
722.807559      0.004695
5188.900935     0.004695
32292.482984    0.004695
495.734247      0.004695
10480.817203    0.004695
5528.363114     0.004695
242.677534      0.004695
2534.000380     0.004695
16372.499781    0.004695
2549.558474     0.004695
760.262365      0.004695
31993.200694    0.004695
22275.751661    0.004695
2557.433638     0.004695
25249.986061    0.004695
Length: 190, dtype: float64
Screenshot:
Conclusions:
- 3 of the variables in the frequency distribution analysis are the type Quantitative.
- ** **The Variable polityscore are categorical and thi type is perfect for the frequency distribution.
- Is very notorious in the polityscore. in Dataset the most common value is 10 whit the 15%. this** **indicate the best performance on the democracy
- for assignment chose additional variable like urbanrate. I evaluate the possibility of filter the countrys whit more urban then others for the impact of democracy. maybe 50% whot do you think, please comment?