Can the Internet use democratizes society? Analysis in graphs

**Question: **Can the Internet use democratizes society?
hypothesis: I am convinced, a deep democracy promotes the welfare of all people actively involved in the democratic process. Some years ago while reading the book Why Nations Fail. Suggested the deep relationship between poverty and lawlessness in the building of democratic institutions.
Code:
#!/usr/bin/env python2.6
# vim: set fileencoding=utf-8 :
# -*- coding: utf-8 -*-
#
#       week4.py
#       Copyright 2015 arpagon
#
#       This program is free software; you can redistribute it and/or modify
#       it under the terms of the GNU General Public License as published by
#       the Free Software Foundation; either version 2 of the License, or
#       (at your option) any later version.
#
#       This program is distributed in the hope that it will be useful,
#       but WITHOUT ANY WARRANTY; without even the implied warranty of
#       MERCHANTABILITY or FITNESS FOR A PARTICULAR PURPOSE.  See the
#       GNU General Public License for more details.
#
#       You should have received a copy of the GNU General Public License
#       along with this program; if not, write to the Free Software
#       Foundation, Inc., 51 Franklin Street, Fifth Floor, Boston,
#       MA 02110-1301, USA.

"""
Examine frequency distributions, for variables internetuserate, polityscore
urbanrate, incomeperperson.

On dataset of gapminder
"""

__version__ = "0.0.1"
__license__ = """The GNU General Public License (GPL-2.0)"""
__author__ = "Sebastian Rojo  @arpagon"
__contributors__ = []
_debug = 0

_question="Can the Internet use democratizes society?"
_hypothesis='''
I am convinced, a deep democracy promotes the welfare of all people actively
involved in the democratic process. Some years ago while reading the book
Why Nations Fail. Suggested the deep relationship between poverty and
lawlessness in the building of democratic institutions.
'''


import pandas
import numpy
import seaborn as sns
import matplotlib.pyplot as plt

data = pandas.read_csv("gapminder.csv", low_memory=False)

print('Dataset gapminder \n')

print('Obeservations:', len(data)) #number of observations (rows)
print('Variables:', len(data.columns)) # number of variables (columns)

print('\n\nVariables chosen for the study are: internetuserate, polityscore')
print('Additional variables for the assignment: urbanrate, incomeperperson')

#internetuserate
data['internetuserate'] = data['internetuserate'].convert_objects(
                                                        convert_numeric=True)
data['polityscore'] = data['polityscore'].convert_objects(
                                                        convert_numeric=True)

sub1=data[['country','internetuserate', 'polityscore', 'urbanrate',
           'incomeperperson']]

data_graph = sub1.copy()

print('''
############################################
##  Explanatory Variable = Internet Use
############################################
''')


# standard deviation and other descriptive statistics for internetuserate
print('\n==Descrive internetuserate ==')
print('Internet users (per 100 people) Internet users are people with access\n'
      'to the worldwide network.')

desc_internetuserate = data_graph['internetuserate'].describe()
print(desc_internetuserate)

#Univariate histogram for quantitative variable:
plt.figure()
sns.distplot(data_graph["internetuserate"].dropna(), kde=False);
plt.xlabel('Internet users (per 100 people)')
plt.title('Histogram of internetuser in the gapminder')
plt.show()
plt.close()

print('''
############################################
##  Response Variable = polityscore
############################################
''')


# standard deviation and other descriptive statistics for internetuserate
print('\n==Descrive polityscore==')
print('''Overall polity score from the Polity IV dataset, calculated by
subtracting an autocracy score from a democracy score. The summary
measure of a country's democratic and free nature. -10 is the lowest
value, 10 the highest.''')

desc_polityscore = data_graph['polityscore'].describe()
print(desc_polityscore)

#Univariate histogram for quantitative variable:
plt.figure()
sns.distplot(data_graph["polityscore"].dropna(), kde=False);
plt.xlabel('Overall polity score')
plt.title('Histogram of polityscore in the gapminder dataset')
plt.show()
plt.close()

print(_question)
print(_hypothesis)

#basic scatterplot:  Q->Q
plt.figure()
scat1 = sns.regplot(x="internetuserate", y="polityscore", data=data_graph)
plt.xlabel('Internet Use Rate')
plt.ylabel('Overall polity score')
plt.title('Scatterplot for the Association Between Internet Use Rate and' \
                                                        'Overall polity score')
plt.show()
plt.close()
Result:
runfile('/home/arpagon/Workspace/DataAnalysisSpecialization/src/week4.py', wdir='/home/arpagon/Workspace/DataAnalysisSpecialization/src')
Dataset gapminder

Obeservations: 213
Variables: 16


Variables chosen for the study are: internetuserate, polityscore
Additional variables for the assignment: urbanrate, incomeperperson

############################################
##  Explanatory Variable = Internet Use
############################################


==Descrive internetuserate ==
Internet users (per 100 people) Internet users are people with access
to the worldwide network.
count    192.000000
mean      35.632716
std       27.780285
min        0.210066
25%        9.999604
50%       31.810121
75%       56.416046
max       95.638113
Name: internetuserate, dtype: float64


############################################
##  Response Variable = polityscore
############################################


==Descrive polityscore==
Overall polity score from the Polity IV dataset, calculated by
subtracting an autocracy score from a democracy score. The summary
measure of a country's democratic and free nature. -10 is the lowest
value, 10 the highest.
count    161.000000
mean       3.689441
std        6.314899
min      -10.000000
25%       -2.000000
50%        6.000000
75%        9.000000
max       10.000000
Name: polityscore, dtype: float64


Can the Internet use democratizes society?

I am convinced, a deep democracy promotes the welfare of all people actively
involved in the democratic process. Some years ago while reading the book
Why Nations Fail. Suggested the deep relationship between poverty and
lawlessness in the building of democratic institutions.

Analysis Results
Frequency Explanatory Variable = Internet Use
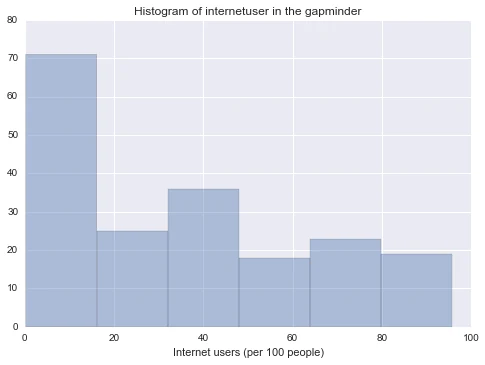
This graph is unimodal, with its highest peak at the start category of 0 to 20 internet user per 100 people. It seems to be skewed to the right as there are higher frequencies in lower categories than the higher categories.
Frequency Response Variable = polityscore
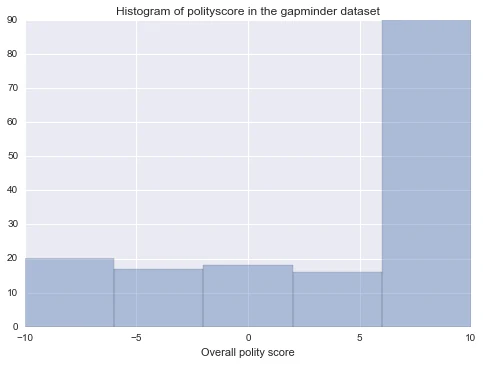
This graph is unimodal, with its highest peak at the qualify og 10. It seems to be skewed to the left as there are higher frequencies in the higher score.
**association between your explanatory and response variables **
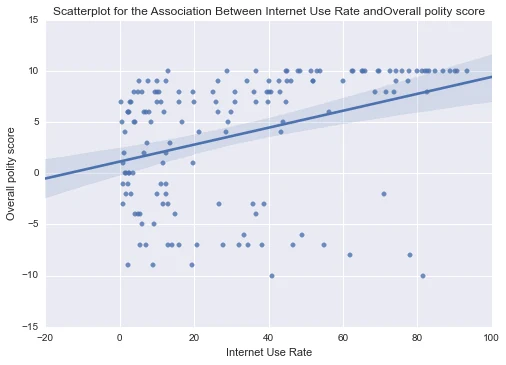
The graph above plots the Overall polity score of a country to the country’s corresponding to Internet Use Rate. We can see that the scatter graph does not show a clear relationship/trend between the two variables.